Just added some new diagrams to describe the internals of the https://thi.ng/block-fs block storage & filesystem (incl. some examples) and also added/updated CLI tooling docs...

. The first example shows how to convert a file tree from the host system into a single binary blob, the second command example shows how to list files/directories from such a blob")

Just added some new diagrams to describe the internals of the https://thi.ng/block-fs block storage & filesystem (incl. some examples) and also added/updated CLI tooling docs...
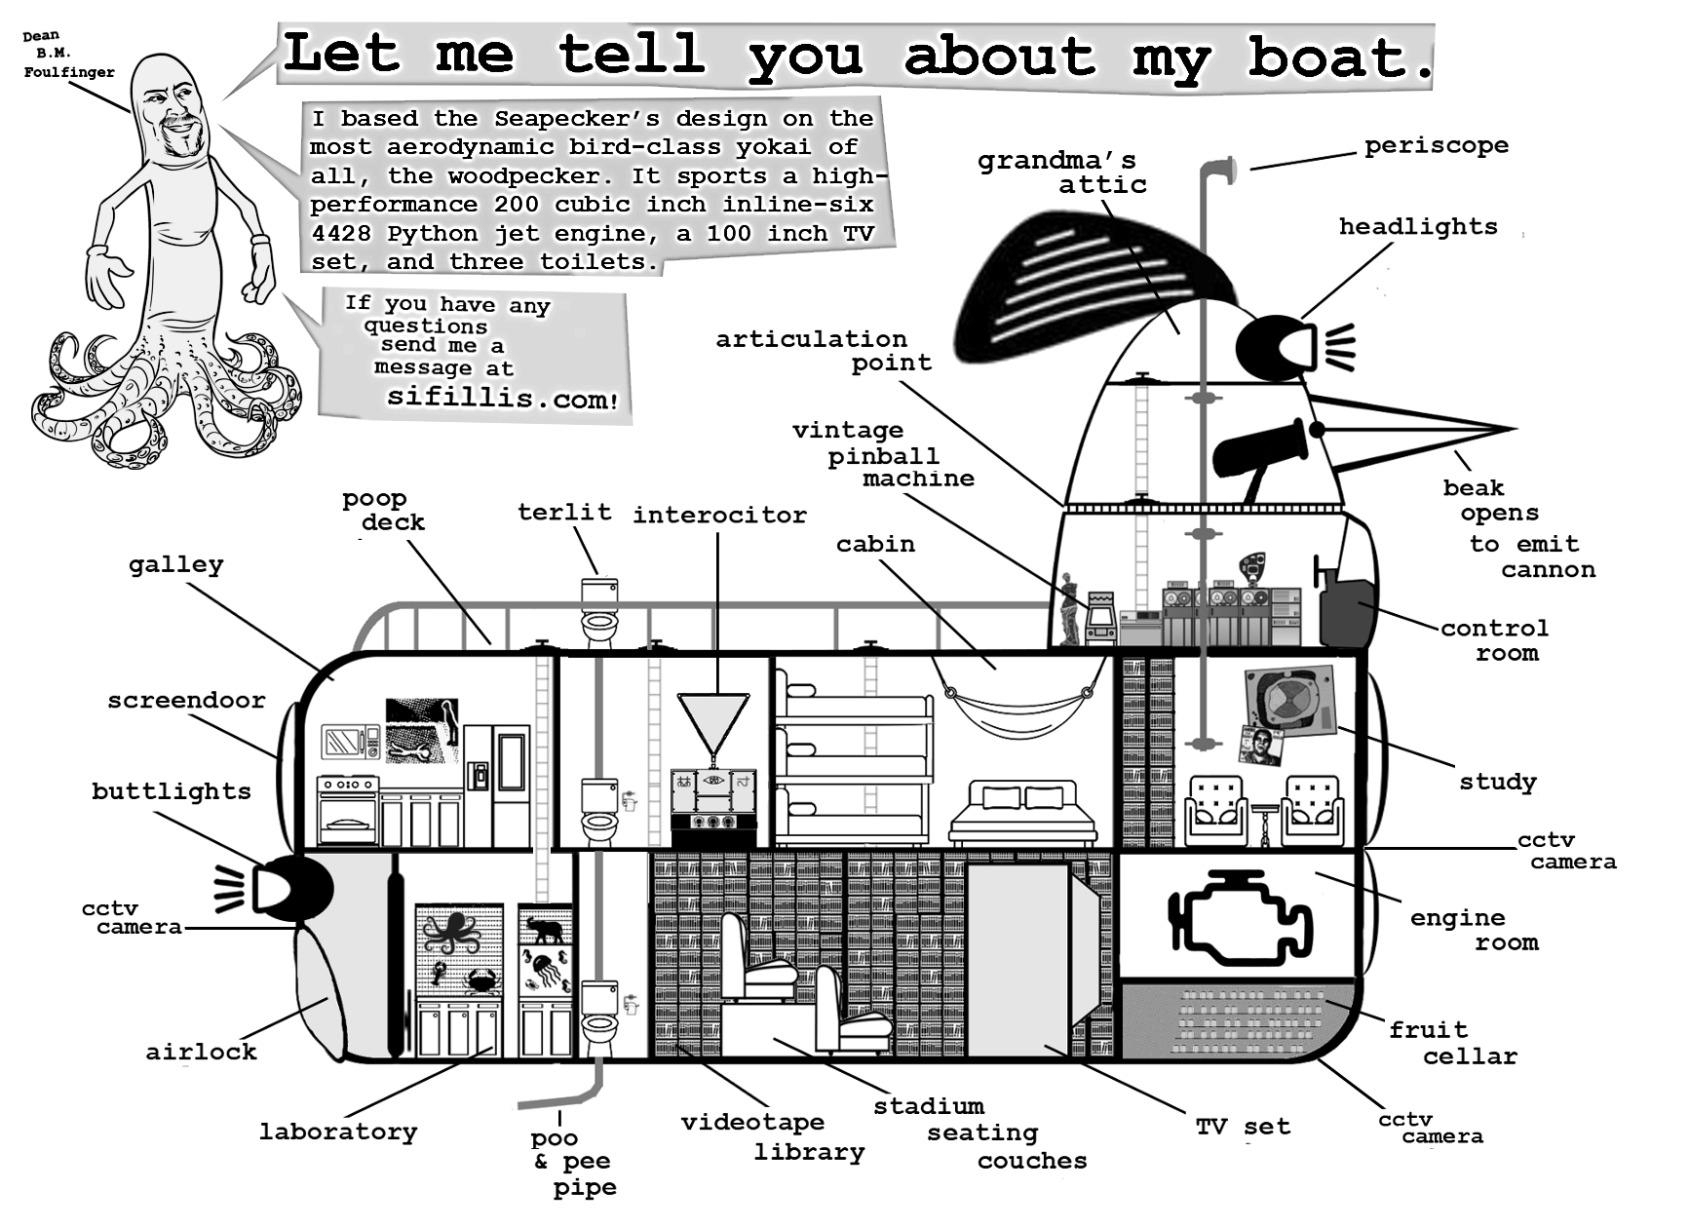
In volume VI ("Wazzfish Kweendom") Educated Emancipated Finger B.M. Foulfinger builds The Seapecker, a woodpecker-shaped ship to go on exploratory expeditions in the Wormspotz Ocean. In volume XI ("Egregious Expeditions") he adopts it for space travel and redubs it "The Spacepecker". Learn more at sifillis.com!
I am excited to announce the  Household Defense Chart Competition.
Create a U.S. Department of Defense-style chart for an everyday household activity. The strategic focus of this competition: Breakfast 
Would you like to know more? Details are here: https://hpincket.com/competition-household-defense-chart.html
You can submit your entry by replying to this post, right here on the Fediverse.
Boosts appreciated.


English translation of the tractor electric diagram from Japanese, should anyone need. This came out a mess when fed to the robot so I had to do it word by word.
Funny colour names they got! Tea = brown. Ash = grey. Wakaba = light green (but what is wakaba?).
Anyways, now I can add some upgrades :)

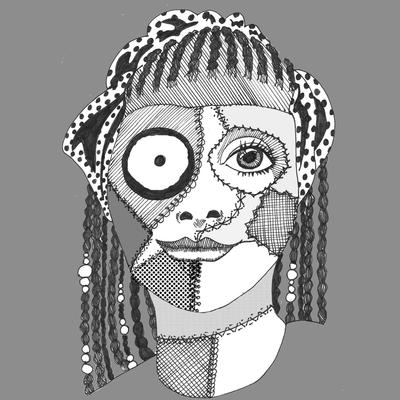
re: ghost types explained
> i saw a video on ghosts and i love paranormal but it used AI art dang... i decided to draw my own icons! real art ghosts
#marubahrt #digitalart #ghost #supernatural #paranormal #diagram #legend #mythology

Back when our youngest two were co-sleeping with us, our nights were long and painful. But we persevered, because love.
I drew this diagram of our sleeping arrangement for posterity. As you can see, I spent most of the night hanging off the bed and being punched by flailing arms.
Somehow we survived. 

Nice! 

quiver: a modern commutative #diagram #editor https://github.com/varkor/quiver #GitHub
[Try it at https://q.uiver.app]
GitHub - pixlsus/pixls-lighting-diagram: Assets to generate lighting diagrams and setups https://github.com/pixlsus/pixls-lighting-diagram #photography #OpenSource #generator #diagram #GitHub #light #photo #plan

This image captures the intricate web of train movements at Manchester Piccadilly, illustrating the organized chaos that underpins urban transport networks. The digital representation of interconnected routes and live timing reflects the dynamic flow of city life and travel.

LayeringSin
For Mathober Curated by @fractalkitty
Blogpost for more posts : https://blog.illestpreacha.com/mathoberconsistency
#mathober #mathart #mathober2024 #mathober9 #consistency
For my ninth sketch of Mathober2024, LayeringSin is coded in Desmos with a consistency of layering sin based equations. Consistency is the 9th Prompt for this year Mathober.
Shaking and Flipping
Tilting and twisting
Spinning and Tipping
Over and Under,
As they wander,
Into a whole new listing
#creativecoding #coding #mathart #graphing
#newmedia #diagram #animation


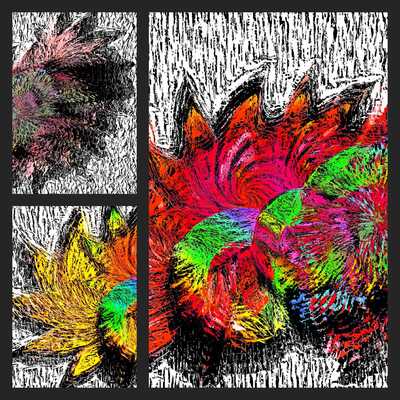
GraphableOres
Blogpost : https://blog.illestpreacha.com/mathober2024flexible
#mathober #mathart #mathober2024 #mathober7 #flexible #graphs
For my eighth sketch of Mathober2024, GraphableOres is coded in #Python with a Ore-like graph that is being stretched and morphed through #Glitchlab. Flexible Graph is the 7th Prompt for this year’s Mathober.
#Poetry
Shaking and Flipping
Tilting and twisting
Spinning and Tipping
Over and Under,
As they wander,
Into a whole new listing
#creativecoding #coding #mathart #graph
#newmedia #diagram #animation


LoggingInSpace
For Mathober Curated by @fractalkitty
Blogpost for more images https://blog.illestpreacha.com/mathober2024log
#mathober #mathart #mathober2024 #mathober16 #Log
For my seventh sketch of Mathober2024, LoggingInSpace is coded in Desmos with a log-based equation. Log is the 16 Prompt for this year Mathober. Aided with #glitchlab
Shaking and Flipping
Tilting and twisting
Spinning and Tipping
Over and Under,
As they wander,
Into a whole new listing
#creativecoding #coding #mathart #3d
#newmedia #diagram #animation


SankeyPartition
Blogpost for More Images/Code : https://blog.illestpreacha.com/mathober2024partition
Mathober made by @fractalkitty
#mathober #mathart #mathober2024 #mathober5 #mathober30 #commutative #partition
For my fifth sketch of Mathober, Which is coded in #MermaidJs, SankeyPartition will be using the 5th prompt of Mathober 2024: Integer Partition and 30th prompt: Commutative. This is done through the Sankey Diagram, where each curve is representing a different partition that is commutative and additional glitching is created with #Glitchlab.
Partitioning the Connections
Connecting the Partitions
Commutative to the
As these numbers are a community
#creativecoding #coding #dataart
#newmedia #diagram #animation


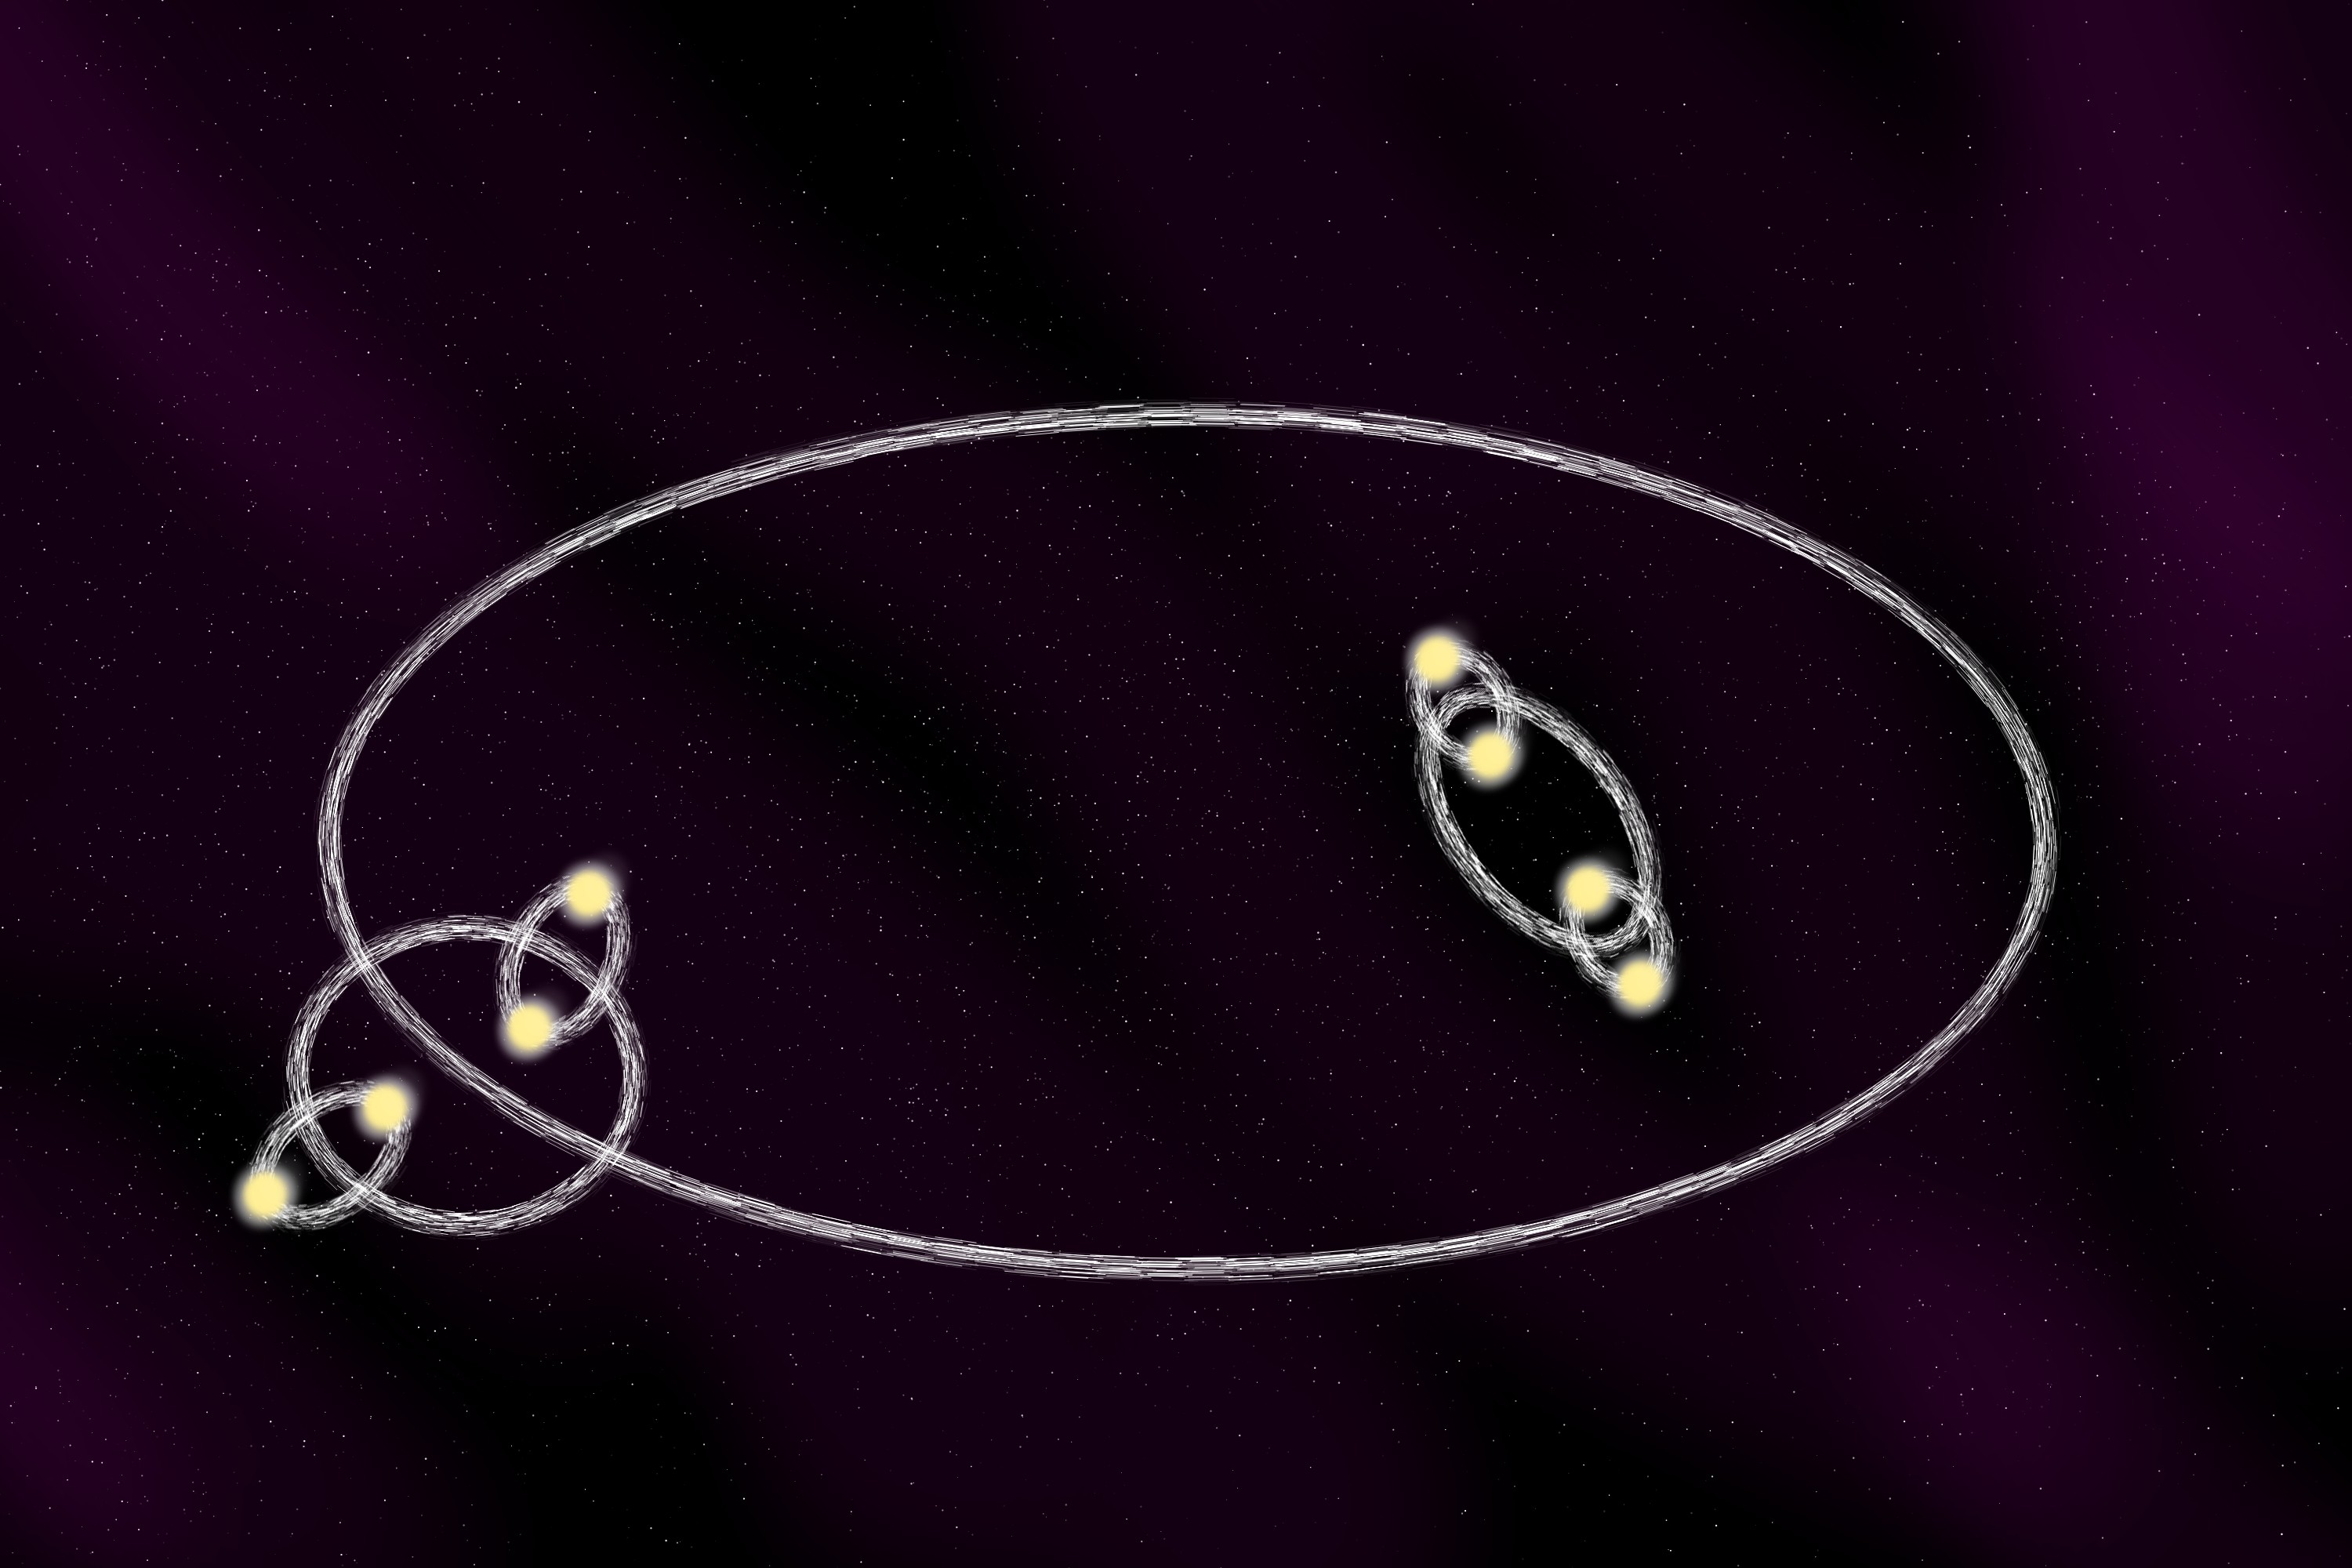
Yes, it's confusing, but that's how star systems work: nested pairs of binaries. In principle they can be scaled up indefinitely, though eventually you reach a system that's more Omega Centauri than Tatooine.  My rendition of an octuple system, "Eight star system diagram".
Hello 
Est ce que vous avez une #app #android qui permet de faire des #diagram ?
Même un truc simple qui permet d'éditer et de voir des #graph #mermaidjs ou autre format textuel.
Et si c'est possible d'intégrer cet outils avec des notes en #markdown ça serait énorme !! 
Merci pour vos #boosts et réponses ! 
I just released a new version of ziaplot, my Python package for drawing geometric diagrams, charts, and discrete data plots. While the well-known plotting libraries focus on plotting discrete data points, ziaplot treats geometric diagrams, such as this unit circle illustration, as first-class citizens. No trig calculations or discretization required from the user.
Docs: https://ziaplot.readthedocs.io/
Source: https://github.com/cdelker/ziaplot

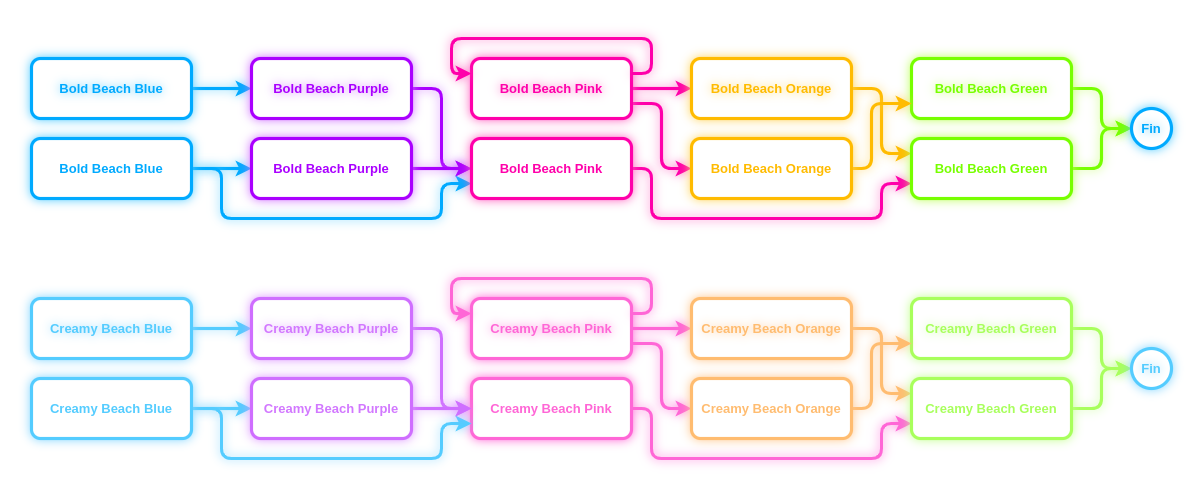
And the full style for Bold Beach Blue, from which you can easily adapt the other colors.
rounded=1;whiteSpace=wrap;html=1;shadow=1;comic=0;strokeColor=#00aaff;strokeWidth=3.1496;align=center;verticalAlign=middle;shadowOffsetX=0;shadowOffsetY=0;shadowBlur=5;shadowColor=#54CCFF;shadowOpacity=100;fontFamily=Helvetica;fontSize=13;fontColor=#00AAFF;labelBackgroundColor=none;fillColor=#FFFFFF;glass=0;textShadow=1;fontStyle=1
4/4
I present: the Beach Dreams style for #drawio. It comes in two neon flavors: Bold Beach and Creamy Beach. Bold Beach is a bit more vibrant, while Creamy Beach is a bit more pastel.
As always with neons, some colors will be less ideal for things like text or small details, so keep that in mind.
Enjoy :)
2/4


 Lascapi ⁂